


Back in July, when we wrote about Google removing four attribution models, we ended with a promise. We said the strongest form of independent measurement is a controlled test, where you deliberately withhold spend in some markets and measure what happens, and that it deserved its own article.
This is that article. And the timing is deliberate, because this is the stretch when people start thinking about running one before the holidays, and Q4 is exactly the wrong time to do it.
Here's the situation most mid-market accounts are in. Google Ads reports a 4x return on ad spend. Meta reports 3.5x. Your email platform claims a chunk too. Someone in finance adds up the attributed revenue across every channel and gets a number bigger than total company revenue. Everybody is taking credit for something, and at least some of them are taking credit for something they didn't cause.
There is exactly one way to find out who. It isn't a better attribution model. It's a control group.
Attribution is not impact
We covered this ground in the attribution article, so briefly: attribution answers the question of the conversions that happened, which touchpoint gets the credit? Last click, data-driven, whatever's left in Google Ads after September, every model is a rule for dividing up credit among things that already occurred.
Incrementality asks a different question entirely. How many of those conversions would have happened anyway?
Brand search is the cleanest example. Someone types your company name into Google, clicks your ad, and buys. Attribution says the ad gets 100% of the credit. Incrementality asks whether that person was already on their way to you, and whether they'd have clicked your free organic listing if the ad hadn't been there. Microsoft's own research on brand bidding puts that figure at 11% to 18% of brand ad clicks that would have gone to the organic result regardless.
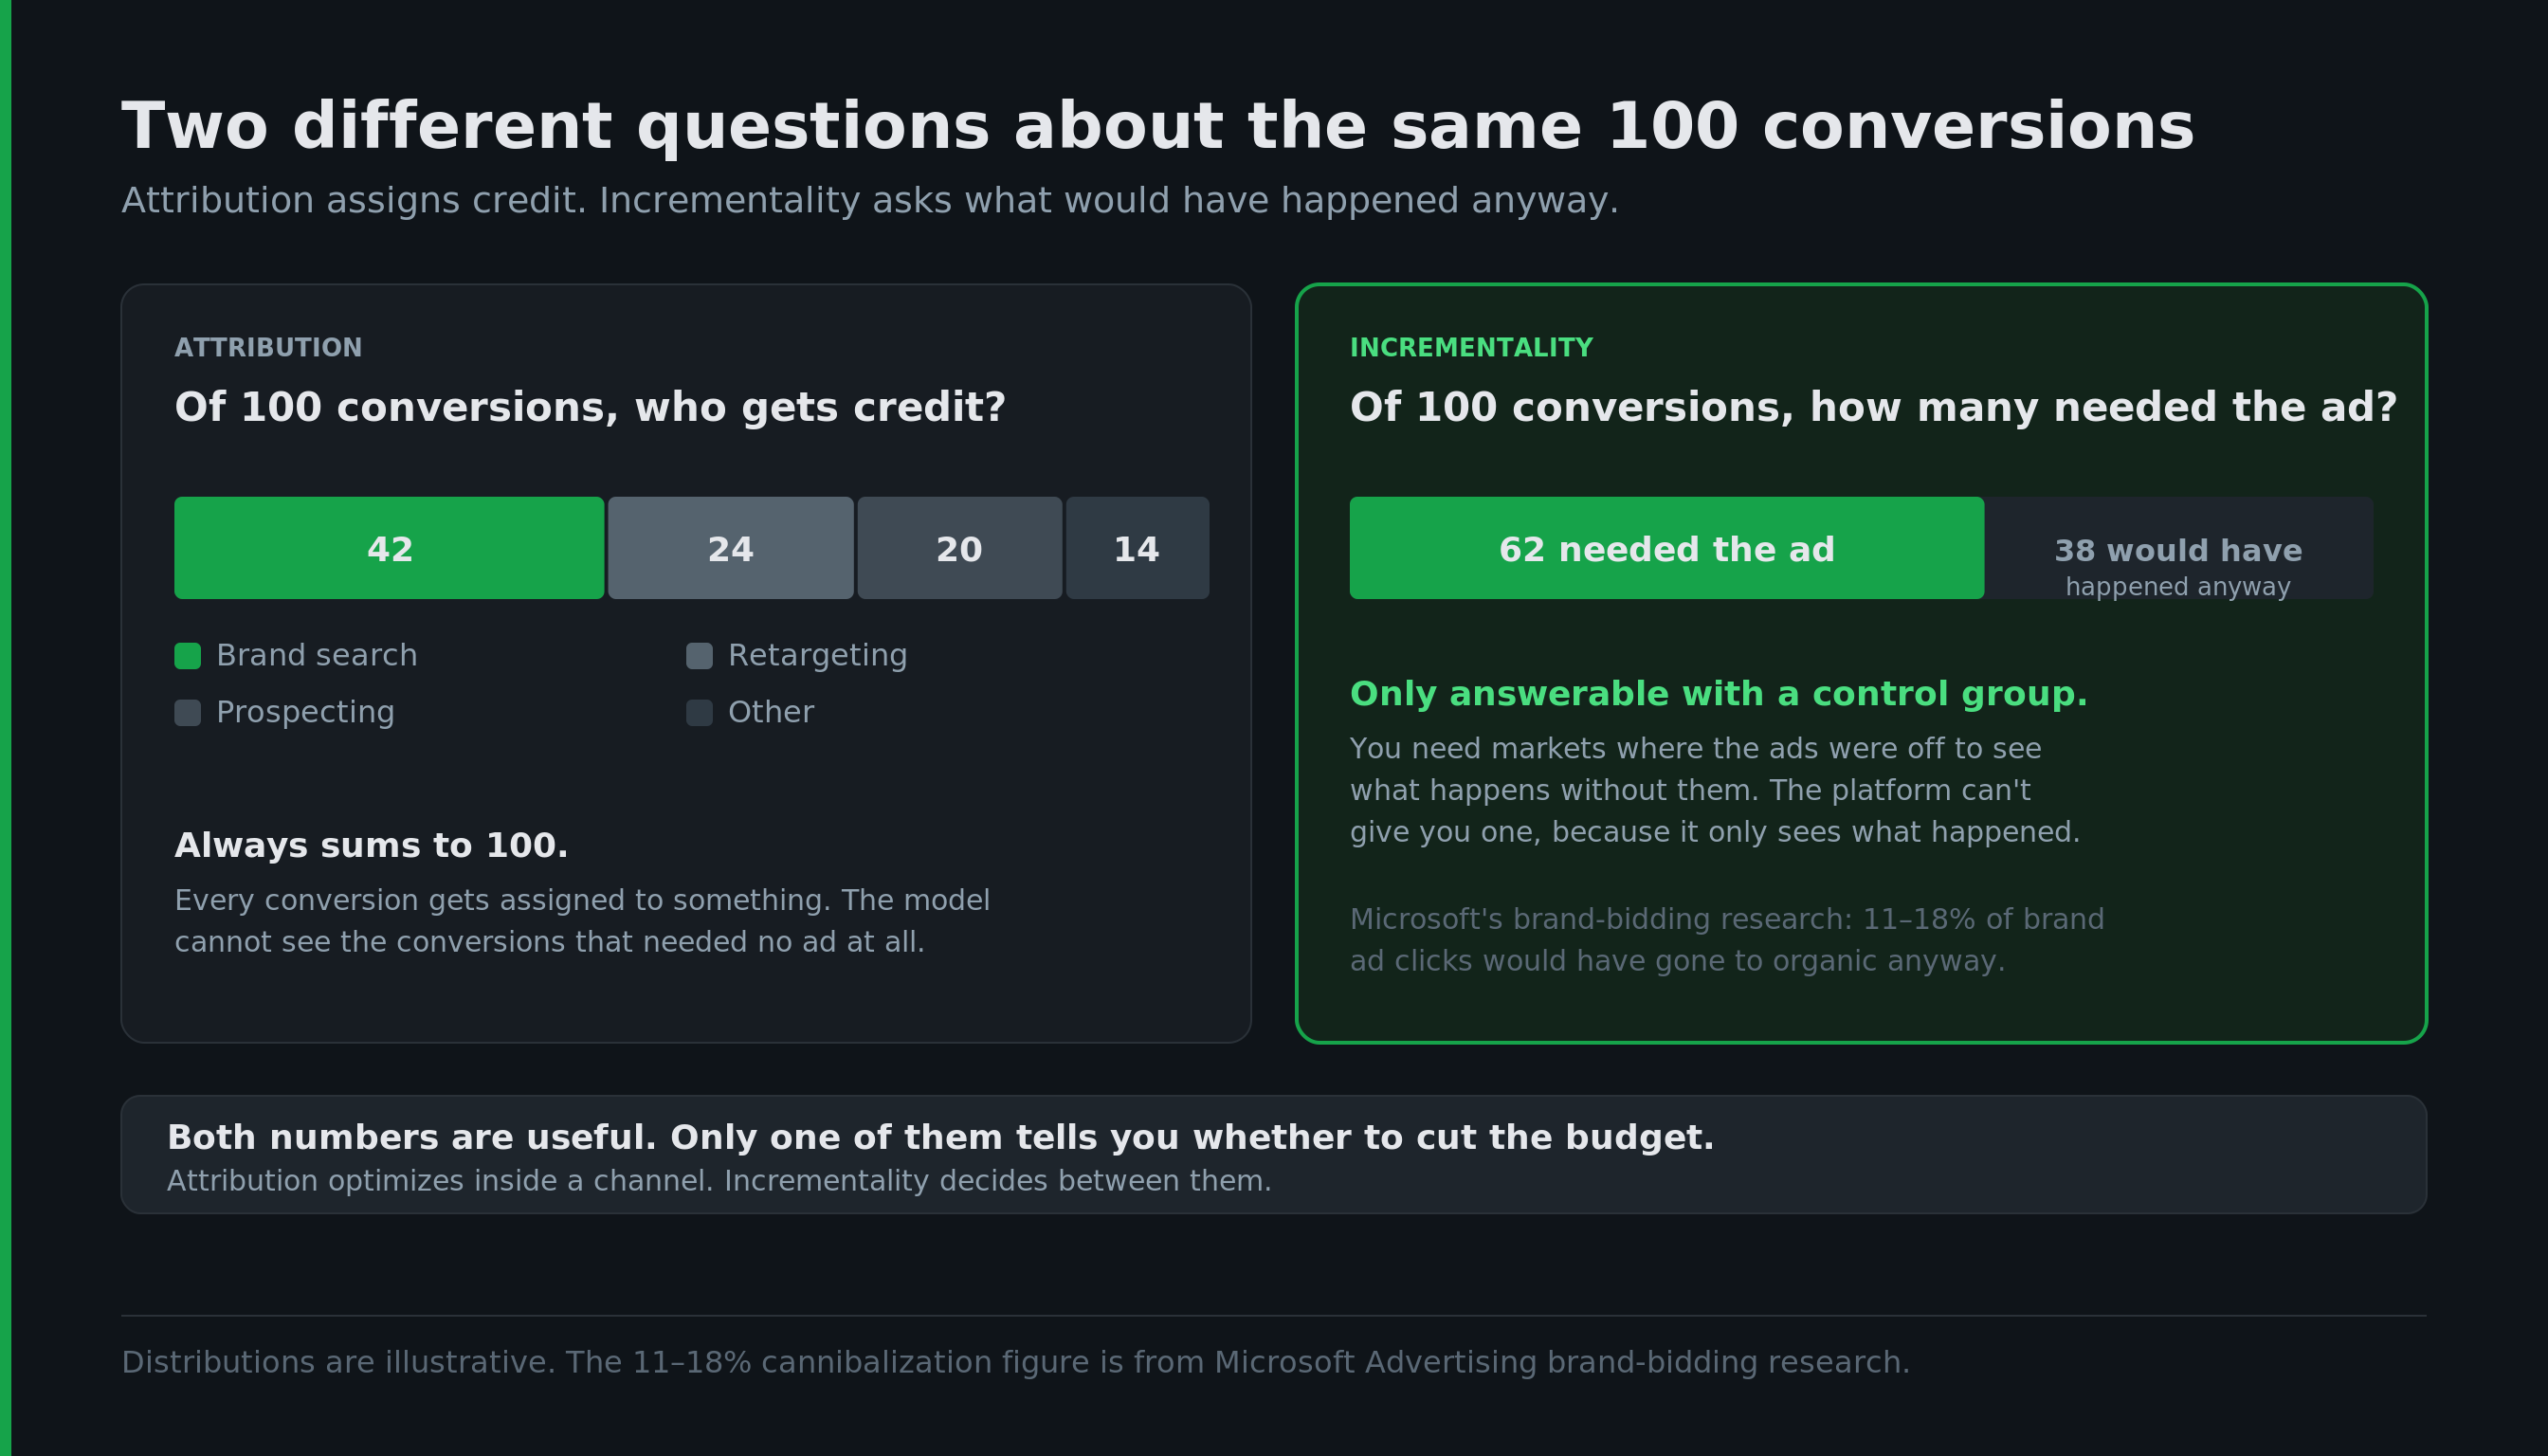
The platforms cannot answer the incrementality question about themselves. Not because they're being dishonest, but because they only see what happened. They have no view of the conversions that would have occurred without them. To see that, you need a group of people who didn't see the ads, behaving as normally as possible, so you can compare.
In 2026 the case for doing this yourself got stronger, not weaker. Third-party signals are largely gone. Performance Max and Advantage+ campaigns obscure campaign-level detail by design. A geographic experiment is one of the few remaining methods that lets you check the platform's homework from outside the platform.
What a geo holdout actually is
The mechanics are simpler than the name suggests.
You divide your market into geographic units. Depending on your scale, those might be states, metro areas, DMAs, or clusters of zip codes.
You match those units into pairs or groups that behave similarly: comparable population, comparable baseline conversion rate, comparable trend over the past couple of months.
You turn your ads off in one half of each pair, the holdout, and leave them running in the other half, the test group.
Then you measure the difference in total outcomes between the two groups over the test period. Not ad-attributed conversions. Total conversions and total revenue, from every source, in each geography.

The gap between the groups, adjusted for how closely they tracked each other before the test started, is the incremental effect of the spend. If the test markets did 20% better than the holdout markets, and they'd been tracking within a point or two beforehand, your ads are responsible for roughly that 20%.
Why geography, rather than splitting individual users? Because you can't reliably split people into test and control anymore. Cookies are unreliable, cross-device tracking is patchy, and the platforms won't give you a clean holdout of their own users. But you can still split cities. Geography is the unit of randomization that still works after signal loss.
Why Q4 will lie to you
Here's the part that makes this a September article instead of a whenever article.
A holdout measures the difference between two groups. Anything that moves both groups at the same time is noise you have to subtract out. In a normal month, that noise is manageable. In Q4, everything moves at once.
Seasonality. Demand in your holdout markets rises through November and December whether you're advertising there or not. A naive read of the numbers credits your ads with Christmas.
Competitor spend. Competitors double and triple their budgets in November. Their activity affects your holdout markets and your test markets differently, and you have no way to control for it.
Your own promotions. A Black Friday offer changes baseline conversion rates by amounts that swamp a 15% to 25% incremental effect. If the offer runs everywhere, it moves both groups. If it runs in some markets and not others, it contaminates the test.
Cost inflation. Cost per click rises 35% to 50% in Q4. The cost side of your return calculation moves mid-test, which means the efficiency number you get at the end doesn't describe any period you'll actually operate in.
Put those together and a Q4 holdout produces a number. It looks like a real number. It might even come with confidence intervals. And what it's actually measuring is Christmas, plus your ads, minus competitor noise, plus or minus whatever your promo calendar did. You will not be able to separate those.
So the honest advice, if you're thinking about running one this fall: don't. Design it now. Run it in January.
Designing one that works at mid-market scale
Most incrementality content is written for brands spending seven figures a month with a measurement team. The principles hold at $10,000 a month. The tolerances are tighter.
Market selection is everything. Poorly matched markets are the single biggest cause of confident wrong answers. Match on population, on baseline conversion rate, and on trend. Then pull four to eight weeks of pre-test data and verify the groups actually move together before you change anything.
You need more pairs than you think. Six to eight matched market pairs is the practical minimum. With fewer, your confidence interval is wide enough that you'll finish the test unable to tell a 15% incremental channel from a 40% one, which is the whole question.
Holdout size. Put 10% to 20% of your addressable market in the holdout group. Enough to produce a readable signal, not so much that you're sacrificing meaningful revenue for the duration.
Validate before you cut. Run a pre-period of equal length with ads on everywhere, and check that test and holdout groups track within 3% to 5% of each other. If they diverge more than that before you've changed anything, your matching is broken. Re-pair the markets and try again. This step is the one everybody wants to skip and the one that decides whether the result means anything.
Duration. Four weeks minimum. Six to eight for a conclusive read. A useful rule: the test should run at least three to four times your average purchase cycle. A two-week test on a product with a three-week consideration window systematically undercounts, because conversions caused by ads in week one land after the test ends.
Volume floor. If the channel you're testing generates fewer than roughly 500 conversions a week across your whole market, a four-week design is probably the only one with enough data to read. Below about $5,000 a month in spend on that channel, be honest with yourself that this may not be feasible yet. Above that, it is, but it requires discipline.
Measure the right thing. Total outcomes in each geography. All conversions, all revenue, every source. If you measure platform-attributed conversions in the test markets, you've just rebuilt the platform's view of itself with extra steps. The point is to escape that view. This is also where closed-loop tracking into your CRM pays off, because it gives you an outcome measure the platform never touches.

One more thing worth verifying before any of this: that your conversion tracking is actually working. A holdout run on broken measurement produces a very confident answer to the wrong question.
What the result tells you, and what to do with it
At the end, you'll have an incrementality percentage: the share of conversions in your test markets that wouldn't have happened without the ads.
The number will be directional, not surgical. A mid-market holdout tells you a channel is roughly 40% to 60% incremental. It does not tell you 43.2%. That's fine. The difference between knowing roughly and guessing entirely is the difference between a budget conversation and a budget argument.
Honest results vary widely by channel. Brand search tends to come in lower than its ROAS suggests, because a lot of those people were already coming. Prospecting and demand generation often come in higher than last-click attribution gives them credit for, because they're doing work that gets attributed to something else downstream. That pattern is one of the reasons we keep telling people not to cut top-of-funnel based on attributed numbers alone.
If the number comes back low, don't panic-cut. A low-incrementality channel might still be worth running at reduced spend for defensive reasons. Brand search is the obvious case: even if most of those people were already yours, the ones who'd otherwise see a competitor's ad first are worth protecting. We'll go deeper on that specific question later this month. The right response to a low number is usually to reallocate, not eliminate.
If the number comes back high, you've got evidence for two things at once: that the channel deserves more budget, and that your attribution model has been undercounting it. Both are useful in the next budget conversation.
Then feed it back into how you read platform reports. If a channel tested at 50% incremental, mentally halve its attributed conversions from now on. You've calibrated the platform's view against reality, which is more than most accounts ever do.
The January plan
Here's what to do with the next three months.
Now through October: pick the channel. Usually the biggest line item with the most uncertainty. For most readers that's either Google brand search or Meta prospecting. Pick one. Testing two things at once doubles the design work and halves the confidence.
November: build the matched pairs. Pull eight weeks of geo-level conversion data. Build the pairs. This is analysis work, not a live test, so it's fine to do it while Q4 is running.
December: validate the matching. Check the pre-period tracking. Fix any pairs that diverge. Write the test plan down, and include the decision rule for each possible result, so that when the number comes in, nobody argues about what it means.
January 5: turn off the holdout. Not January 1. The first few days of the year still carry post-holiday behavior in a lot of categories. Run four to eight weeks. Touch nothing else in the account for the duration.
Late February to early March: read the result. Make the reallocation decision before Q2 budgets lock.
That's the whole plan. It's a quarter of preparation for a month of testing, which sounds like a lot until you compare it to the alternative, which is another year of making budget decisions off numbers the platform generated about itself.
Bottom line
Attribution tells you who got credit. A geo holdout tells you what actually caused what. It's the strongest measurement tool available at mid-market scale, and the easiest one to botch, most reliably by running it in Q4 when seasonality swamps every other signal.
Spend the next three months designing it. Run it in January. Make the budget decision in March.
Designing a holdout well is fiddly, and most of the value is in the market matching. If you'd like a second set of eyes on the design before you turn anything off, that's the kind of thing we help with. You keep the test plan either way. And if you want to see how measurement fits into how we run paid media more broadly, that page covers the process.
